Multicore debugging challenges in Zephyr RTOS: Part 3 – Inter-core messaging
In modern embedded systems, especially those with multiple cores, it’s common to divide tasks between different cores or threads to make the system faster, more responsive, and energy efficient. For this to work well, the cores need a safe way to share data and stay in sync with each other. That’s where Inter-Process Communication (IPC) comes in. It allows different processes to exchange information and work together smoothly. IPC can be achieved through two main methods: shared memory and message passing, both of which are supported by the operating system to ensure efficient and reliable communication between processes.
By Bea Ben-Ali
Introduction
In modern embedded systems, especially those with multiple cores, it’s common to divide tasks between different cores or threads to make the system faster, more responsive, and energy efficient.
For this to work well, the cores need a safe way to share data and stay in sync with each other. That’s where Inter-Process Communication (IPC) comes in. It allows different processes to exchange information and work together smoothly. IPC can be achieved through two main methods: shared memory and message passing, both of which are supported by the operating system to ensure efficient and reliable communication between processes.
In parts 1 and 2 of this blog series, we tackled debugging race conditions and cache coherency issues to ensure synchronization across cores and improve system reliability; both of which are part of the “shared memory model” of IPC. Now, let’s dive into another primary IPC mechanism: “message passing.” Message queues are another exciting debugging challenge to overcome.
For the purpose of this blog, we will focus on symmetric multiprocessing (SMP) systems rather than asymmetric multiprocessing (AMP) systems. Implementing message queues in SMP is much less complex. Our goal is to provide an introduction to inter-core messaging and explain how it works.
"This series is a conceptual guide for engineers entering multicore Zephyr development. The goal is to make you aware of where the hard problems live before you run into them in production and to show you which tools exist to address them when you do."
Debugging inter-core messaging issues
Let’s take a quick look at how two cores exchange information using a message queue:
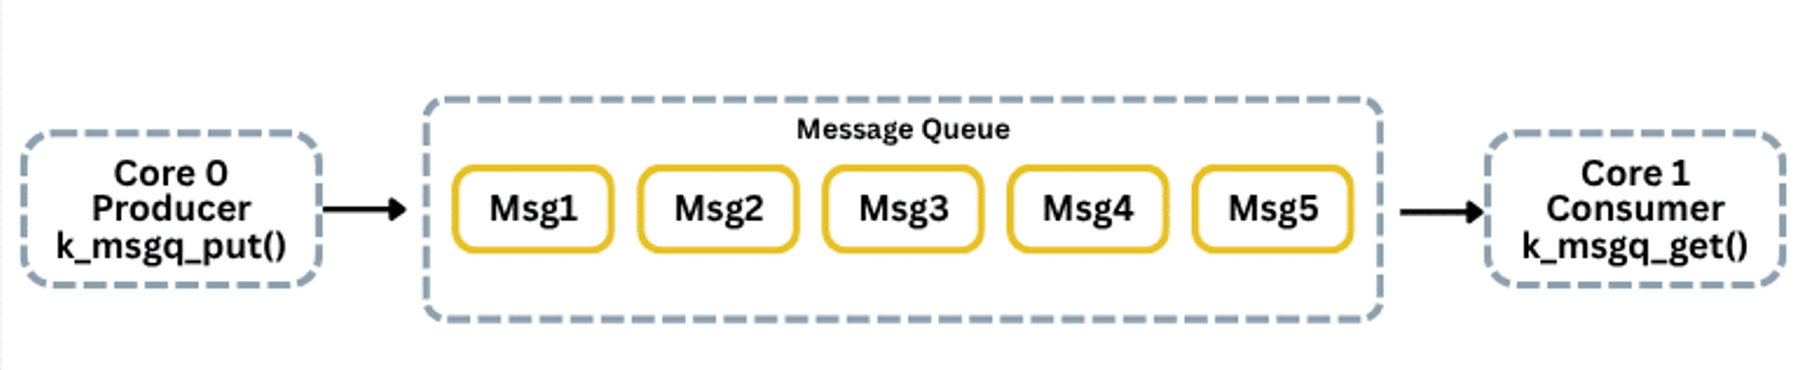
Here, Core 0 runs a producer task and uses k_msgq_put(). Core 1 runs a consumer task and retrieves messages via k_msgq_get().
Messages can be missed or corrupted if the receiving core is busy, interrupts occur, or the queue fills up. These issues lead to lost data, incorrect messages, or queue overflows.
Overcoming inter-core messaging issues on Zephyr RTOS systems with SystemView and Ozone
As in earlier parts of this series, we instrument firmware using SystemView to log events and inspect message flow across cores.
Set up Zephyr Configuration system (Kconfig)
To enable real-time debugging and performance monitoring in a multicore Zephyr setup, several key Kconfig options must first be configured:
CONFIG_SMP=yCONFIG_MP_MAX_NUM_CPUS=2 // utilize both cores in dual-core systemCONFIG_DEBUG=yCONFIG_DEBUG_THREAD_INFO=y // extra runtime checks, thread insightsCONFIG_TRACING=y // enables system tracingCONFIG_SEGGER_SYSTEMVIEW=yCONFIG_USE_SEGGER_RTT=y // real-time data streaming via RTTThese settings create a powerful environment for debugging multicore applications.
Integrate SystemView
Zephyr’s message queue API allows cores or threads to safely send/receive messages. We connect SystemView to trace queue behavior.
#include <zephyr/kernel.h>#include <zephyr/sys/printk.h>#define MSGQ_MAX_MSGS 10#define MSG_SIZE sizeof(uint32_t)struct k_msgq devheads_msgq;K_MSGQ_DEFINE(devheads_msgq, MSG_SIZE, MSGQ_MAX_MSGS, 4);The K_MSGQ_DEFINE macro creates the message queue at compile time, defining its name, message size, max messages, and alignment.
Alternatively, you can initialize it manually:
char msg[MSGQ_MAX_MSGS * MSG_SIZE];k_msgq_init(&devheads_msgq, msg, MSG_SIZE, MSGQ_MAX_MSGS);Event IDs for SystemView
#define EVENT_ID_MSG_SENT 32#define EVENT_ID_MSG_RECEIVED 33Sender thread:
void core0_thread(void *p1, void *p2, void *p3){uint32_t msg = 0;while (1) {msg++;int ret = k_msgq_put(&devheads_msgq, &msg, K_NO_WAIT); if (ret == 0) {SEGGER_SYSVIEW_RecordU32(EVENT_ID_MSG_SENT, msg);SEGGER_SYSVIEW_PrintfHost("Core 0: Sent message %u", msg);} else {SEGGER_SYSVIEW_PrintfHost("Core 0: Queue full, message %u dropped", msg);}k_sleep(K_MSEC(1000));}} K_THREAD_DEFINE(core0_id, 1024, core0_thread,NULL, NULL, NULL, 5, 0, 0);Receiver thread:
void core1_thread(void *p1, void *p2, void *p3){ uint32_t msg; while (1) { int ret = k_msgq_get(&devheads_msgq, &msg, K_FOREVER); if (ret == 0) { SEGGER_SYSVIEW_RecordU32(EVENT_ID_MSG_RECEIVED, msg); SEGGER_SYSVIEW_PrintfHost("Core 1: Received message %u", msg); } else { SEGGER_SYSVIEW_PrintfHost("Core 1: Queue error %d", ret); } }} K_THREAD_DEFINE(core1_id, 1024, core1_thread, NULL, NULL, NULL, 5, 0, 0);Queue-full instrumentation
int ret = k_msgq_put(&devheads_msgq, &msg, K_NO_WAIT);if (ret != 0) { #if defined(CONFIG_SEGGER_SYSTEMVIEW) /* SEGGER_SYSVIEW_Warn flags the event visually in the * SystemView timeline */ SEGGER_SYSVIEW_Warn("Queue full: message dropped"); /* PrintfHost logs the exact error code to the Ozone * terminal */ SEGGER_SYSVIEW_PrintfHost("Queue put failed: error %d, " "msg %u dropped", ret, msg);#endif }Using Ozone watchpoints, you can monitor queue length and message values over time to detect latency, drops, or unexpected stalls. This gives deeper visibility into system behavior.
Closing
This concludes our debugging series. We explored practical challenges in multicore embedded systems using Zephyr RTOS and demonstrated how tools like SEGGER SystemView and Ozone enhance understanding of system behavior.
We hope you enjoyed the series — stay tuned for more hands-on tutorials and insights!