Multicore debugging challenges in Zephyr RTOS: Part 1 – Race conditions
Race conditions are often a subtle and difficult-to-detect problem that can lead to unpredictable behavior that is hard to reproduce. This is especially the case in multicore systems, where each core can hold threads that run simultaneously.
By Bea Ben Ali
Race conditions are often a subtle and difficult-to-detect problem that can lead to unpredictable behavior that is hard to reproduce. This is especially the case in multicore systems, where each core can hold threads that run simultaneously.
The Zephyr RTOS is rapidly gaining traction in embedded and IoT development due to its native support for multicore systems, modular design, and active developer ecosystem. These capabilities make it particularly well suited for advanced multicore platforms where efficient inter-core communication, deterministic real-time behavior, and system-level scalability are essential. But then, race conditions.
Debugging multicore systems often presents this type of challenge. There are also methods for getting back on track. Using SEGGER’s SystemView performance analyzer and Ozone debugger, we’ll explore:
- Race condition problems in multicore systems that can be resolved by using debugging techniques that avoid observability gaps, leading to better accuracy.
- Assigning separate RTT buffers for each core, including how a central RTT Control Block can help to decide where each core’s buffer should be stored and configure the buffers based on the number of cores.
- Logging cores individually so logs can be filtered by context or core, including ways to view or hide log data on a per-core basis
- Detecting synchronization bottlenecks like mutex contention so they appear clearly in the timeline and even within a developer’s application
"This series is a conceptual guide for engineers entering multicore Zephyr development. The goal is to make you aware of where the hard problems live before you run into them in production and to show you which tools exist to address them when you do."
Race condition analysis
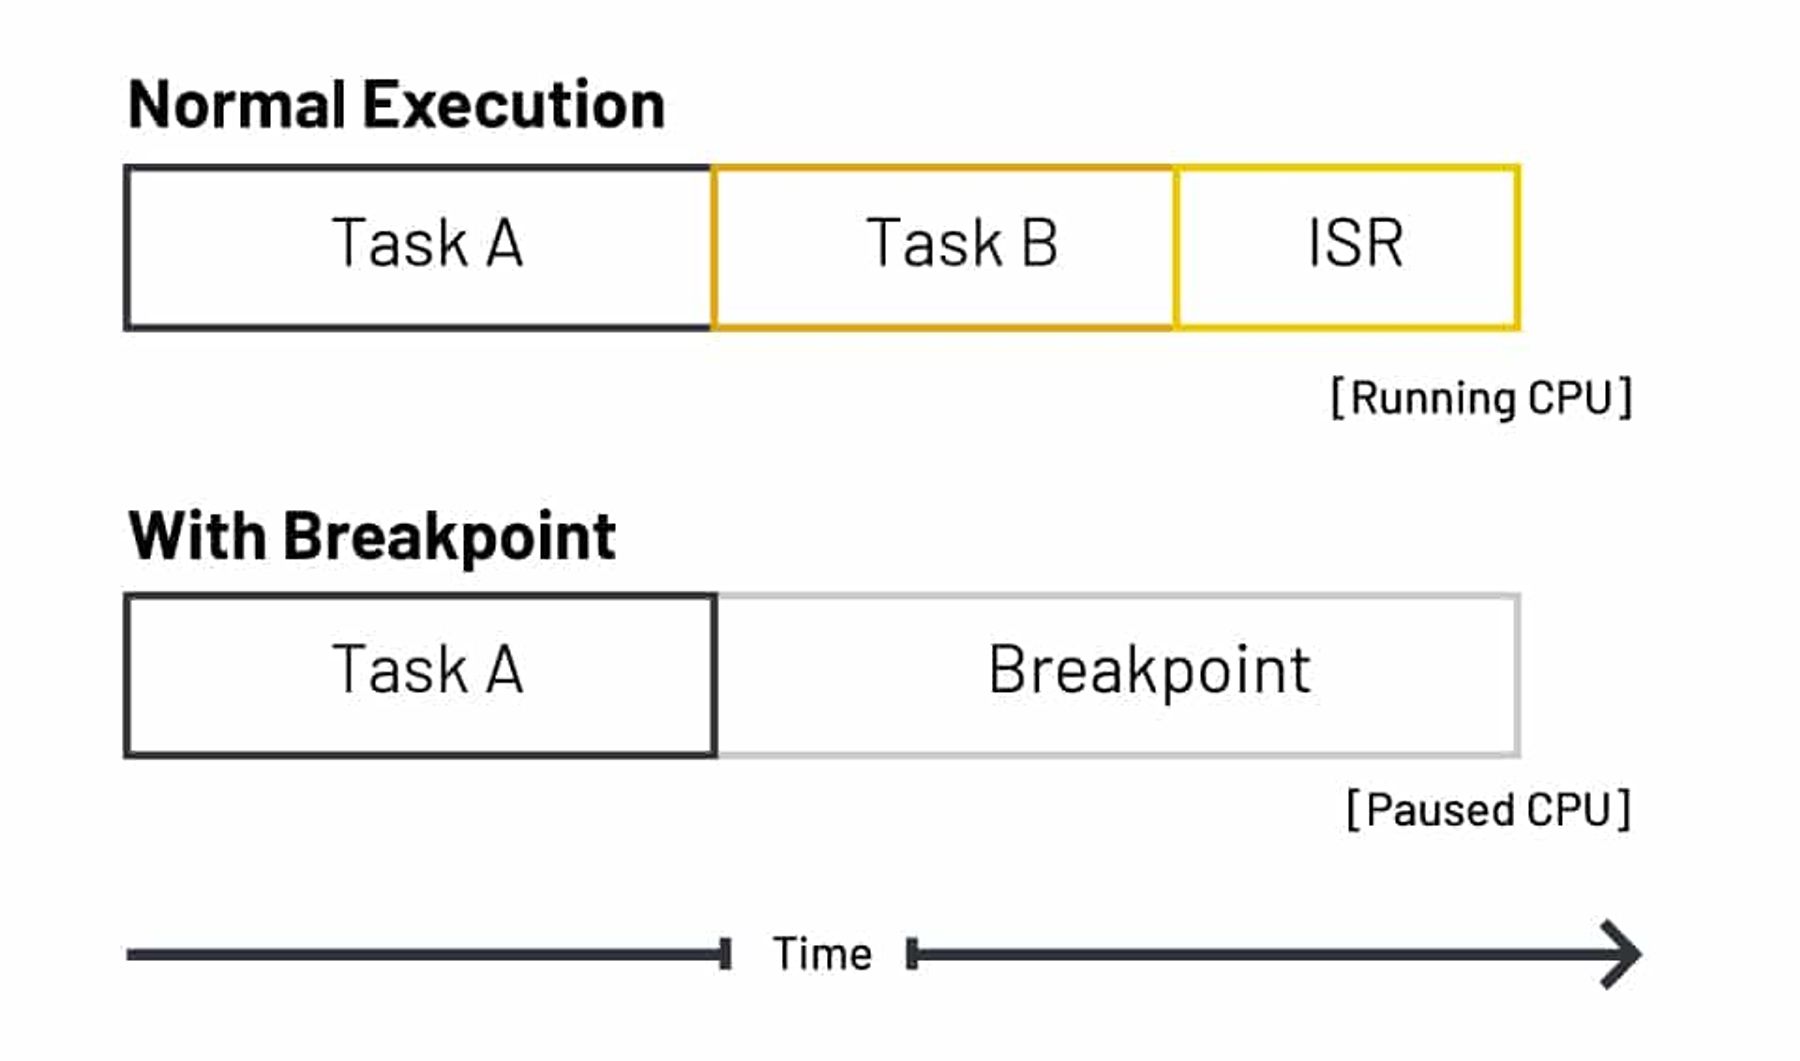
When multiple threads execute in parallel, they may unpredictably access shared data. This can lead to race conditions. A developer’s first instinct might be to start debugging using breakpoints and stepping methods. The downside to debugging this way is it means running one core and pausing the other. Pausing cores makes it hard to catch race conditions and creates what’s called an observability gap where missing context prevents a developer from seeing the complete picture of a system.
While hardware watchpoints can help to some extent, they can’t keep track of every shared memory access across both cores. The difference between running with and without breakpoints is shown below in timeline view:
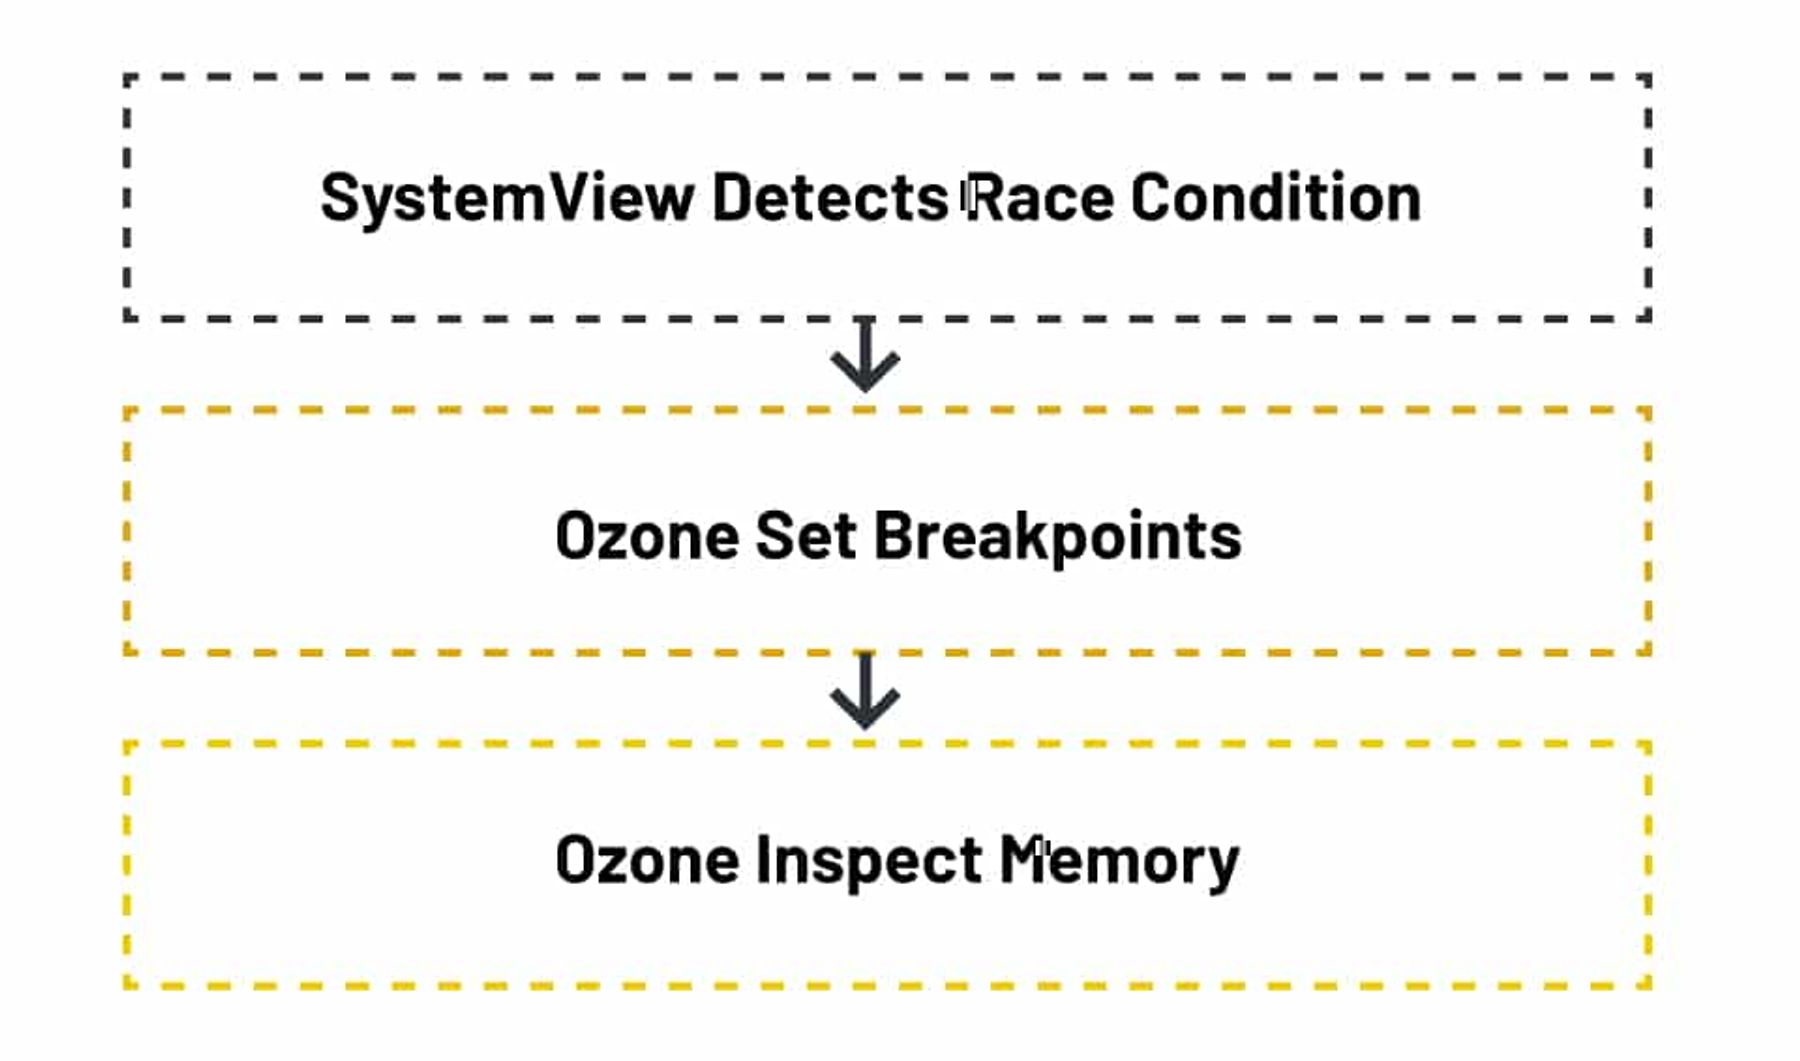
By using SEGGER’s Ozone debugger and SystemView real-time software analysis tool, debugging can be improved and the time it takes to spot, diagnose, and fix race conditions and other problems can be reduced. For instance, breakpoints in Ozone can be configured so that the debugger stops only under certain conditions, allowing us to check precisely when data was corrupted or deviated from the expected value in memory. The workflow for each tool is illustrated below:
Overcoming race conditions on Zephyr RTOS systems with SystemView with Ozone support
Using SystemView to log system events requires us to instrument our target firmware. This means initializing the SEGGER SystemView library and adding event recording macros at key points in the code.
Initializing SystemView in multicore systems running Zephyr
To create a Zephyr application, write find_package(Zephyr) at the beginning of the application CMakeLists.txt file and specify the version used.
find_package(Zephyr REQUIRED HINTS $ENV{ZEPHYR_BASE})project(multicore_debugging)Multiprocessing support needs to be enabled when Zephyr is running in a multicore system. The following describes how multiprocessing and several other options can be configured using Kconfig.
- Define the maximum number of CPUs (cores)
CONFIG_MP_MAX_NUM_CPUS=2# For dual-core as an example2. How to enable debug symbols:
CONFIG_DEBUG=y // to allow debuggingCONFIG_DEBUG_THREAD_INFO=y // to allows debugging tools like OpenOCD and J-link to inspect thread data info3. How to enable tracing:
CONFIG_TRACING=y // Enable tracing featuresCONFIG_SEGGER_SYSTEMVIEW=y // Enable tracing using systemviewCONFIG_USE_SEGGER_RTT=y // Logging using RTTCONFIG_TRACING_BACKEND_RAM=y // collect trace data into RAMThe variable CONFIG_RAM_TRACING_BUFFER_SIZE can be added to Kconfig options to allocate sufficient RAM for recording as much trace data as needed.
Assign separate RTT buffers for each core
RTT is a proven high-speed mechanism designed to transmit data in real time during debugging or at runtime. To prevent data conflicts in a multicore environment, each core should have its own dedicated RTT buffer. This ensures that trace data from different cores is not combined inadvertently. To implement RTT in a multicore system:
- Define a separate RTT buffer for each core
- Initialize RTT for each core and link it to its respective buffer.
Do not forget to ensure that each core writes to its designated buffer. This helps maintain data integrity.
RTT buffers can be configured based on the direction of data transfer:
- Up-buffer (target to host), where the target writes data into the up-buffer and the J-Link probe reads and forwards it to the PC.
- Down-buffer (host to target), where the host is sending data to the target device.
The SEGGER_RTT_ConfigUpBuffer() is part of the SEGGER RTT library used to configure RTT buffers in bare-metal or non-Zephyr projects. It encompasses the buffer index, a descriptive name, a pointer to the memory buffer, the buffer size, and the desired operating mode in Zephyr, we will use Kconfig instead:
CONFIG_SEGGER_RTT_BUFFER_SIZE_UP=1024CONFIG_SEGGER_RTT_MAX_NUM_UP_BUFFERS=3 // 1 + NumberOfCoresThese options can be found under zephyr repo under this path zephyr/modules/segger
CONFIG_SEGGER_RTT_MAX_NUM_UP_BUFFERS int "Maximum number of up-buffers" DEFAULT 3CONFIG_SEGGER_RTT_BUFFER_SIZE_UP int "Size of the buffer for terminal output of target, up to host" DEFAULT 1024Zephyr does not automatically assign an RTT buffer to each core, so it’s up to you to decide which core writes to which buffer. To differentiate them, lets take this example and define the below macros in the main file:
#if defined(CONFIG_CORTEX_M7)#define RTT_CHANNEL 0#defineCORE_NAME "M7"#elif defined(CONFIG_CORTEX_M4)#define RTT_CHANNEL 1#defineCORE_NAME "M4"#else#define RTT_CHANNEL 0#defineCORE_NAME "CORE"#endifNext, print to the RTT channel that corresponds to the current core. SEGGER_RTT_printf(RTT_CHANNEL, …) ensures that each core writes to its own RTT buffer. The Zephyr kernel sets up SystemView tracing automatically, capturing events like thread switches, mutex operations, and interrupts for all cores. To keep logs distinct, simply use separate RTT channels and log messages for each core. This gives a clear per-core view of what’s happening, only without the extra configuration.
Detecting synchronization bottlenecks: Mutexes and Deadlocks
Multicore systems face two related but distinct synchronization problems: race conditions and deadlocks. A race condition occurs when two cores access shared data without proper ordering guarantees. A deadlock occurs when two cores are each waiting on a resource the other holds and neither can proceed.
The scenario below is a deadlock but it is worth showing here because both problems become visible in SystemView's timeline and are often discovered during the same debugging session:
- Core0: TaskA holds mutex X and is waiting for mutex Y
- Core1: TaskB holds mutex Y and is waiting for mutex X
Logging mutex lock and unlock events gives SystemView the visibility to catch both situations. In Zephyr, SystemView integrates with the kernel through predefined instrumentation hooks that automatically record scheduler and synchronization events. The code below adds explicit mutex event logging on top of that default behavior useful when you need finer-grained visibility into which mutex is being contested and by which core:
#define EVENT_ID_MUTEX_LOCK 32 //the user-defined event IDs can hold values from 32 to 511#define EVENT_ID_MUTEX_UNLOCK 33And use the following APIs inside your wrapper functions
SEGGER_SYSVIEW_RecordU32(EVENT_ID_MUTEX_LOCK, (U32)mutex); // Log mutex lock attemptSEGGER_SYSVIEW_RecordU32(EVENT_ID_MUTEX_UNLOCK, (U32)mutex); // Log mutex unlockedWith these events recorded, SystemView's timeline will show each mutex lock and unlock per core making the circular wait pattern of a deadlock visible directly in the trace, without needing to reproduce the hang under a breakpoint.
Up next: Cache coherency
We have shown how to debug a potential race condition and capture the event using SystemView. With the help of Ozone, we can also conduct a detailed analysis at the memory and register levels to gain deeper insight into the issue. Next we will explore cache coherency in multicore systems. When she’s not spending time with her daughter, Bea Ben Ali architects, analyzes, and builds safety-critical embedded software. Follow her on LinkedIn.